
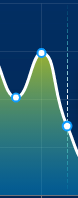
如上,那根竖线,是 ECharts 自动演示时的指示线,这根线上端、下端是渐隐的,如何实现呢?
主要是为 axisPointer 设置 linear 的线性样式。
option -> tooltip -> axisPointer -> lineStyle -> color
var option = {
	tooltip: {
		trigger: 'axis',
		axisPointer: {
			lineStyle: {
				color: {
					type: 'linear',
					x: 0,
					y: 0,
					x2: 0,
					y2: 1,
					colorStops: [{
						offset: 0,
						color: 'rgba(0, 255, 233,0)'
					}, {
						offset: 0.5,
						color: 'rgba(255, 255, 255,1)',
					}, {
						offset: 1,
						color: 'rgba(0, 255, 233,0)'
					}],
					global: false
				}
			},
		},
		backgroundColor: 'rgba(2,56,115,0.8)',
		borderColor: '#00b3ff',
		textStyle: {
			align: 'left',
			color: '#fff',
			fontWeight: 'normal'
		}
	}
}

